A Comprehensive Understanding of Purchase Frequency

For retail businesses, repeat customers are the backbone of sustainable revenue. While attracting new shoppers is important, it’s the returning buyers who drive consistent sales and profitability.
This is where purchase frequency becomes essential – it measures how often your customers come back to make additional purchases.
Purchase frequency isn’t just another metric to track. It’s a powerful indicator of customer loyalty and satisfaction. When customers return frequently, it shows they value what you offer. More importantly, it demonstrates your ability to maintain engagement beyond that first sale.
Purchase frequency provides actionable insights and helps to answer critical questions like:
- Are your marketing efforts creating one-time buyers or loyal customers?
- Which products or promotions drive the most repeat business?
- Where are these opportunities to improve the customer experience?
The most successful retailers don’t just track purchases – they understand the patterns behind them. Let’s explore how you can use purchase frequency to build a more predictable, profitable business.
What Is Purchase Frequency?

Purchase frequency measures how often your customers buy from you within a specific time. In simple terms, it tells you how frequently the average customer returns to make a purchase.
Why It Matters for Your Business
This metric reveals crucial insights about:
- Customer loyalty – Do shoppers come back or disappear after one purchase?
- Revenue predictability – Can you count on steady sales, or are you constantly chasing new customers?
- Marketing effectiveness – Are your promotions and rewards driving repeat visits?
How Purchase Frequency Works?
Let’s say you run a liquor store:
- Customer A buys wine 4 times in 3 months → Their purchase frequency is 1.3 times per month (4 purchases ÷ 3 months).
- Customer B shops only once a year → Their frequency is 0.08 times per month (1 ÷ 12 months).
Purchase Frequency in Sales Analytics
Retailers use this metric to:
- Identify loyal customers (who buys most often?)
- Spot drop-offs (did a regular shopper stop coming?)
- Test strategies (e.g., does a new rewards program increase visits?)
Key Metrics Related to Purchase Frequency
Purchase frequency doesn’t exist in isolation – it connects to other critical retail metrics that shape your profitability. By understanding these relationships, you can make smarter decisions to boost revenue, retention, and customer loyalty.
Let’s break down the three most important linked metrics:
1. Repeat Purchase Rate
What it means: The percentage of customers who make more than one purchase from you.
Why It Matters:
– Shows how well you convert first-time buyers into repeat customers
– High repeat rate = strong brand loyalty
– Low repeat rate = need to improve retention strategies
Example:
If 200 out of 500 customers return for a second purchase, your repeat purchase rate is 40%.
2. Customer Lifetime Value (CLV) & Purchase Frequency
What it means: The total revenue a customer generates over their entire relationship with your business.
The Connection:
– Purchase frequency directly impacts CLV – the more often customers buy, the higher their lifetime value.
– Increasing frequency without discounting is one of the most profitable ways to grow CLV.
Example:
– A customer who buys 4 times a year (frequency) with an average order value of $50 has a $200/year CLV.
– If you increase their frequency to 6 times/year, their CLV jumps to $300/year – a 50% increase with no price changes.
3. Average Order Value (AOV) & Purchase Frequency
What it means: The average amount spent per transaction.
The Relationship:
– Often, higher frequency leads to lower AOV (customers buy smaller amounts more often).
– Lower frequency may mean higher AOV (customers stock up less frequently).
– The goal? Balance both – encourage frequent purchases without sacrificing order size.
Example:
A liquor store might find:
– Weekly shoppers spend $25 per trip (high frequency, lower AOV).
– Monthly shoppers spend $100 per trip (low frequency, higher AOV).
– Ideal strategy: Reward frequency while occasionally incentivizing larger baskets (e.g., “Spend $75, get $10 off”).
How to Calculate Purchase Frequency?
Purchase frequency is simple to calculate, but to use it effectively, you need to understand the formula, time frames, and customer segments.
Let’s break it down.
The Basic Formula:
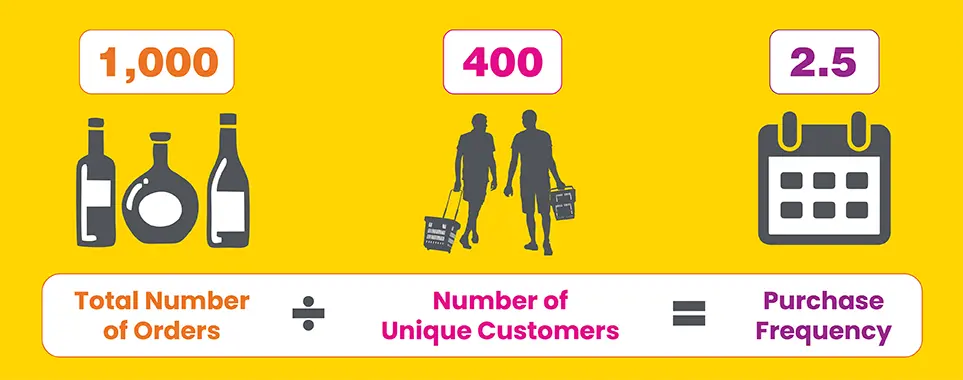
Purchase Frequency = Total Number of Orders ÷ Number of Unique Customers
Example:
– A liquor store processes 1,000 orders in a quarter.
– These orders come from 400 unique customers.
– Purchase Frequency = 1,000 ÷ 400 = 2.5
Interpretation:
The average customer shops 2.5 times in that quarter.
Advanced Considerations for Smarter Analysis
1. Time Frames Matter
Purchase frequency changes depending on the period you measure. Comparing different time frames helps spot trends.
| Time Frame | Total Orders | Unique Customers | Purchase Frequency |
|---|---|---|---|
| Monthly | 300 | 150 | 2.0 |
| Quarterly | 1,000 | 400 | 2.5 |
| Yearly | 4,500 | 800 | 5.6 |
Key Insight:
– A monthly frequency of 2.0 means customers shop twice a month on average.
– A yearly frequency of 5.6 suggests some customers buy more often over time.
Best Practice: Track both short-term (monthly) and long-term (yearly) frequency to see if loyalty is improving.
2. Segmentation Reveals Hidden Opportunities
Not all customers behave the same. Segmenting helps identify your most (and least) valuable buyers.
Example Segments:
| Customer Group | Total Orders | Unique Customers | Purchase Frequency |
|---|---|---|---|
| Rewards Members | 800 | 200 | 4.0 |
| Non-Members | 200 | 200 | 1.0 |
| Whiskey Buyers | 600 | 150 | 4.0 |
| Beer Buyers | 400 | 250 | 1.6 |
Key Takeaways:
– Rewards members buy 4x more often than non-members → Loyalty programs work!
– Whiskey buyers are highly engaged → Could you promote other spirits to them?
– Beer buyers shop less frequently → Could discounts or bundles increase visits?
Why Measuring Purchase Frequency is Critical for Your Business?
Purchase frequency is a powerful indicator of your business’s health. Tracking it helps you predict revenue, improve retention, and optimize marketing spend. Here’s why it matters:
1. Increases Customer Lifetime Value (CLV)
How It Works:
– Customers who buy more frequently generate more revenue over time.
– Even a small boost in frequency can significantly raise CLV.
Key Benefit:
Focusing on frequency is more profitable than constantly chasing new customers.
2. Enhances Customer Loyalty
How It Works:
– High purchase frequency = stronger customer habits.
– It shows repeat trust in your brand, not just one-time purchases.
Key Benefit:
Loyal customers are less price-sensitive and more likely to refer others.
3. Makes Marketing More Cost-Efficient
How It Works:
– Retaining customers is cheaper than acquiring new ones.
– Increasing frequency means higher Return on Investment (ROI) from loyalty programs, emails, and promotions.
Key Benefit:
Reduce wasted ad spend by targeting your most frequent buyers.
The Big Picture
| Metric | Why It Matters |
|---|---|
| High Purchase Frequency | Predictable revenue, loyal customers, efficient marketing |
| Low Purchase Frequency | Unusual sales, high churn, wasted acquisition costs |
Purchase Frequency vs. Repeat Customer Rate: What’s the Difference?
While both metrics measure customer loyalty, they reveal different insights about buyer behavior.
Let’s clarify:
Side-by-Side Comparison
| Metric | Purchase Frequency | Repeat Customer Rate |
|---|---|---|
| Definition | How often customers buy from you within a period | What percentage of customers return to buy again |
| Formula | Total Orders ÷ Unique Customers | Repeat Customers ÷ Total Customers |
| Focus | Behavior of active buyers (frequency of purchases) | Retention effectiveness (ability to bring customers back) |
| Example | “Our average customer shops 3x/year” | “40% of first-time buyers return” |
Industry Benchmarks & Examples
Understanding how your purchase frequency compares to industry standards helps identify strengths and opportunities. Here’s how different sectors measure up:
1. Retail (Brick-and-Mortar Stores)
Typical Purchase Frequency:
- Grocery Stores: 12–24 times/year (weekly shoppers)
- Liquor Stores: 6–12 times/year (monthly to biweekly)
- Apparel Stores: 2–4 times/year (seasonal buying)
Why It Varies:
High-frequency (grocery/liquor): Essential, habit-driven purchases.
Low-frequency (apparel): Occasional, need-based buying.
Example:
A wine shop with a 4.0 annual purchase frequency (the average customer buys quarterly) could:
Launch a wine subscription club to boost frequency to 6–8x/year.
Offer “Monthly Pick” discounts to encourage regular visits.
2. Ecommerce
Typical Purchase Frequency:
Mass Merchants (Amazon, Walmart): 3–6 times/year
Flash Sale Sites: 4-8 times/year (deal-driven)
Key Insights:
Higher frequency is often tied to subscriptions (e.g., monthly replenishment).
Low frequency may indicate high AOV (customers stock up).
Example:
An online spirit’s store notices:
Frequency = 1.8/year → Most buyers purchase only during holidays.
Strategy: Introduce limited-edition quarterly releases to incentivize repeat buys.

3. Subscription Services
Typical Purchase Frequency:
Curated Boxes (e.g., wine clubs): 12 times/year (monthly)
Replenishment (e.g., coffee): 6–24 times/year (biweekly to monthly)
Why It’s Unique:
Predictable frequency (built into the model).
Focus shifts to reducing churn and increasing upsells.
Example:
A craft beer subscription service:
Baseline Frequency: 12 shipments/year.
Upsell Tactic: Offer “Bonus Seasonal Packs” to raise frequency to 15x/year.
Strategies to Increase Purchase Frequency: Best Practices
1. Building Customer Relationships
Strong connections turn shoppers into regulars. Focus on personalized service, follow-ups, and community engagement to build up loyalty.
2. Implementing Loyalty Programs
Reward repeat purchases with points, tiers, or exclusive perks to incentivize more frequent visits.
3. Diversified Product Offerings
Expand inventory with complementary products (e.g., snack pairings for liquor) to encourage add-on purchases.
4. Personalized Marketing
Use purchase history to recommend relevant products (“You liked this whiskey—try this new batch!”).
5. SMS & Email Marketing
Automate reminders for restocks, limited-time deals, or abandoned carts to prompt repeat buys.
Related Read: How Optimized Email Marketing Boosts Customer Loyalty
6. Subscription Models
Offer recurring deliveries (e.g., monthly wine clubs) for predictable, high-frequency revenue.
7. Post-Purchase Engagement
Follow up with thank-you discounts or surveys to keep your brand top-of-mind.
Analyzing Purchase Frequency Data: Turn Numbers into Action
To optimize purchase frequency, you need the right tools to track behavior and the skills to interpret data. Here’s how to do it effectively:
1. Tools & Software for Tracking
1.1 Customer Relationship Management (CRM) Systems
What They Do: Track individual customer interactions, purchase history, and engagement.
Key Features:
- Customer segmentation (e.g., frequent vs. one-time buyers)
- Automated loyalty rewards based on purchase frequency
- Personalized follow-ups (birthday discounts, restock reminders)
1.2 Analytics Platforms
What They Do: Uncover trends in purchase timing, product preferences, and campaign performance.
Key Features:
- Cohort analysis (How does frequency change over time?)
- AOV vs. frequency correlations
- Campaign ROI tracking (Which promotions drive repeat sales?)
2. Interpreting Data for Smarter Decisions
2.1 Identifying Patterns
High-Frequency Customers:
Who they are: regulars, subscription members, and deal seekers
Opportunity: Reward them to maintain loyalty (e.g., VIP tiers)
Low-Frequency Customers:
Who they are: seasonal buyers, first-timers, and discount-only shoppers
Opportunity: Win them back with “We miss you” offers or surveys
2.2 Adjusting Strategies
If frequency drops:
Test SMS nudges (“Your favorite bourbon is back in stock!”)
Introduce bundles (e.g., “Buy 2, Get 10% Off Next Visit”)
If frequency spikes:
Double down on what’s working (e.g., referral bonuses)
Upsell to high-frequency buyers (e.g., limited-edition releases)
Challenges and Solutions in Managing Purchase Frequency
Even the most successful businesses face hurdles when trying to increase how often customers purchase. While purchase frequency is a powerful metric for driving predictable revenue, real-world obstacles like data gaps, market saturation, and changing consumer habits can stall growth. The good news? Every challenge has a solution.
1. Data Accuracy
- Challenge: Incomplete or outdated customer data skews frequency metrics.
- Solution: Use integrated point-of-sale (POS)-CRM systems to automate real-time tracking.
2. Consumer Privacy
- Challenge: Stricter data laws limit purchase history access.
- Solution: Implement opt-in loyalty programs that reward data sharing.
3. Market Competition
- Challenge: Competitors lure customers away with aggressive deals.
- Solution: Differentiate personalized rewards (e.g., “Early access” perks for frequent buyers).

4. Changing Consumer Behavior
- Challenge: Shifting trends (e.g., less alcohol consumption) reduce natural frequency.
- Solution: Diversify offerings (e.g., non-alcoholic bundles) to maintain engagement.
5. Cost Management
- Challenge: Over-incentivizing erodes profits.
- Solution: Tier rewards by profitability (e.g., bonus points instead of deep discounts).
Wrapping Up
Understanding and optimizing purchase frequency is about building habits that drive predictable revenue. By analyzing how often customers return, you gain actionable insights to:
- Boost retention by rewarding loyal buyers
- Increase lifetime value (CLV) without relying on discounts
- Run cost-efficient marketing campaigns focused on high-frequency segments
Whether you’re a local retailer or growing e-commerce brand, improving this metric means fewer customer acquisition costs, steadier cash flow, and stronger relationships.

FAQs
Higher purchase frequency means more predictable demand, helping you:
- Optimize stock levels for fast-moving items
- Reduce overstocking of low-frequency products
- Schedule supplier orders more accurately
For example, a liquor store noticing whiskey buyers return monthly can adjust inventory before peak buying periods.
Seasonal variations can significantly impact purchase frequency, with holidays or summer often driving spikes, while post-holiday periods typically see a decline.
Solution: Compare Year-Over-Year (YoY) data, analyze trends, and plan promotions accordingly.
In general, lower-priced products account for higher purchase frequency (e.g., budget wines), whereas premium-priced products generate lower frequency (e.g., rare spirits). The best way to balance is to use bundling (e.g., 3 for $20) to boost frequency without slashing margins.
It will be a tedious, time-consuming, and error-prone method, but still, you can use spreadsheets to export POS data monthly and can track the repeat customer percentage manually. You may also take advantage of Google Analytics if you have an ecommerce store.
First, you must calculate the average time between purchases per customer and then perform an RFM analysis (Recency, Frequency, Monetary) to forecast behavior.
The simplest way to go about adjusting frequency calculations is by,
- Excluding canceled orders from totals
- Count exchanges as 1 purchase (not 2) and,
- Flag frequent returners for review
Loyal-n-Save helps retailers to set up personalized marketing automation with an auto trigger campaign. You can send VIP/early-access offers to high-frequency buyers and simultaneously can run Win-back discounts for low-frequency buyers.
Call it loyalty, punch cards, or app-based rewards – these are various types of reward systems to increase engagement with your customers. Loyalty and punch cards boost short-term frequency (e.g., Buy 9, get the 10th free). On the other hand, app-based rewards or digital rewards drive long-term habits (e.g., points for every $1 spent).
Posted on May 28, 2025

Danielle is a content writer at Loyal-n-Save. She specializes in writing about implementing loyalty solutions proven to help a company grow.
Content Writer